Custom Legends in NgX Charts using Angular
This post will guide you through creating custom legends in NgX charts using Angular. NgX Charts library lacks easy customization of its legends. Searched over the internet and tried multiple solutions, there is hardly anything available. Why not create our own legends! Hope this helps :)

Introduction
NgX charts if one of the open source libraries used for Data Visualization using Angular. It renders and animates the SVG elements using angular features.
NgX Charts provides a variety of customizations for all of its features. You can view all of its features and types of charts available here:
Though, it does not provide any room for customizing the UI for legends. One of the reasons why I prefer Chart.js, where the charts are highly scalable and customizable.
But, developers might have boundaries. Maybe the requirement is specific. There might be a case where it is easier and preferable for you to use NgX Charts. Don’t worry, I have your back :)
(I assume you already have knowledge on NgX Charts and Angular. If you are stuck at any step, post your queries in the comments section)
Step1: Generate Angular project & Install NgX Charts
Create Angular Project
ng new ngx-custom-legendsInstall NgX Charts
npm install @swimlane/ngx-charts --save(Any issues while installing please refer the documentation and videos)
Install Bootstrap
npm install bootstrap(Make sure you add bootstrap in the angular.json)
Install D3
npm install @types/d3 --save-devInstall Angular CDK
npm install @angular/cdkPlease try running your application and make sure everything is installed correctly and running fine. Also make sure your NgX Chart version is compatible with your Angular version.
Step2: Import NgXChartsModule and Draw Chart in the app.component
Import NgXChartsModule in app.module.ts file
import { NgModule } from '@angular/core';
import { BrowserModule } from '@angular/platform-browser';
import { NgxChartsModule } from '@swimlane/ngx-charts';
import { BrowserAnimationsModule } from '@angular/platform-browser/animations'

import { AppComponent } from './app.component';;

@NgModule({
  declarations: [
    AppComponent
  ],
  imports: [
    BrowserModule,
    NgxChartsModule,
    BrowserAnimationsModule
  ],
  providers: [],
  bootstrap: [AppComponent]
})
export class AppModule { }
In your app.component.html draw the chart. (I am using a simple Vertical Bar Chart in this example)
Add following HTML code in app.component.html:
<div class="container row mx-auto mb-5 shadow mt-3">

    <h3>Custom Legend using NgX Bar Chart</h3>
    <small class="text-muted">Lorem ipsum dolor sit amet, consectetur adipisicing elit.</small>

    <div class="container">
        <ngx-charts-bar-vertical
          [view]="[600,400]"
          [results]="sampleData"
          [xAxisLabel]="'Country'"
          [yAxisLabel]="'Sale'"
          [showXAxisLabel]="true"
          [showYAxisLabel]="true"
          [xAxis]="true"
          [yAxis]="true"
          [animations]="true"
          [showDataLabel]="true"
        >
        </ngx-charts-bar-vertical>

  </div>
In your app.component.ts, define the sampleData variable used above:
import { Component } from '@angular/core'

@Component({
  selector: 'app-root',
  templateUrl: './app.component.html',
  styleUrls: ['./app.component.css']
})
export class AppComponent {
  title = 'Custom-Legends';

  sampleData = [
    { name: "Germany", value: 105000 },
    { name: "USA", value: 55000 },
    { name: "France", value: 15000 },
    { name: "Spain", value: 150000 }
  ]

  constructor(){}

}
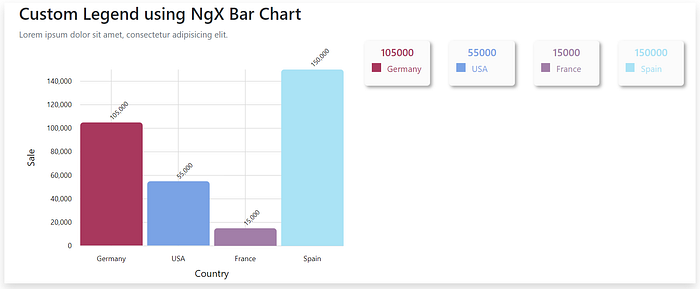
This step should draw a simple vertical bar chart for you.
There is a property available for legends in NgX Charts, but customizing it might be a headache. Here’s a simple way!
Step3: Create a Custom Legend component
ng g c custom-legendAdd following TypeScript code in custom-legend.component.ts:
import { Component, Input, OnInit, OnChanges, SimpleChanges } from '@angular/core';
import { Observable, Subscription } from 'rxjs';

@Component({
  selector: 'app-custom-legend',
  templateUrl: './custom-legend.component.html',
  styleUrls: ['./custom-legend.component.css']
})
export class CustomLegendComponent implements OnInit, OnChanges {

  @Input() data: any = [];
  @Input() height !: string;
  @Input() width !: string;
  @Input() onTrueHoverEvent: Observable<void> = new Observable<void>;
  @Input() onFalseHoverEvent: Observable<void> = new Observable<void>;
  private trueEventSubscription !: Subscription;
  private falsEeventSubscription !: Subscription;

  constructor() { }

  ngOnInit(): void {
    this.heightWidthManipulate();
  }

  //used to detect hover events in the parent component
  ngOnChanges(changes: SimpleChanges): void {
    if (changes) {
      this.unsubscribeRegisteredEvents();
      this.trueEventSubscription = this.onTrueHoverEvent.subscribe((hoveredElement) =>
        this.hoverLegendTrue(hoveredElement)
      )
      this.falsEeventSubscription = this.onFalseHoverEvent.subscribe((hoveredFalseElement) =>
        this.hoverLegendFalse(hoveredFalseElement)
      )
    }
  }

  ngOnDestroy(): void {
    this.unsubscribeRegisteredEvents();
  }

  unsubscribeRegisteredEvents(): void {
    if (this.trueEventSubscription)
      this.trueEventSubscription.unsubscribe();

    if (this.falsEeventSubscription)
      this.falsEeventSubscription.unsubscribe();
  }

  //adding 'vmin' to the input string for html height and width property.
  heightWidthManipulate(): void {
    this.height = this.height + "vmin";
    this.width = this.width + "vmin";
  }

  //this function defines the UX changes on Hover.
  hoverLegendTrue(event: any): void {
    (document.querySelector('[aria-label="' + event.value.name + '-legend"]') as HTMLElement).style.backgroundColor = 'rgb(230, 230, 230)';
  }

  hoverLegendFalse(FalseEvent: any): void {
    (document.querySelector('[aria-label="' + FalseEvent.value.name + '-legend"]') as HTMLElement).style.backgroundColor = 'rgb(251, 251, 251)';
  }

}
Explanation:
- We are getting the data from the parent component using the Input() decorator. This data includes all the data that is required such as value & color code. We will pass this data from the app.component later.
- We are using the Input() decorator for getting the height and width for the legend cards. heightWidthManipulate() function assigns the height and width to the global variables.
- We are subscribing to the hover events triggered in the parent component. There are two events that should get triggered, first when the cursor hovers over one of the bar within the chart. And the second when it moves out of the bar. We will trigger these events in app.component.
- Both these events are subscribed in ngOnChanges(), and we are changing the background color of the legend using the unique selectors.
Add following HTML code in custom-legend.component.html file:
<div class="row">
    <div *ngFor="let item of data; let i = index" [ngStyle]="{'width': width, 'height': height }"
        [attr.aria-label]="item.name + '-legend'" class="container shadow-legend ms-4 mb-4">
        <h4 class="mt-2 legendTextAlignNumber" [style.color]="item[i]">{{item.value}}</h4>
        <div class="box" [style.background-color]="item[i]"></div>
        <p class="legendTextAlignLabel" [style.color]="item[i]">{{item.name}}</p>
    </div>
</div>
Add following CSS code in custom-legend.component.css file:
.shadow-legend{
    box-shadow: 3px 3px 5px #a9a9a9;
    border-radius: 5px;
    background-color: rgb(251, 251, 251);
    word-wrap: break-word;
    display: block;
}

.shadowAfterHover{
    box-shadow: 3px 3px 5px #a9a9a9;
    border-radius: 5px;
    background-color: #a9a9a9;
    word-wrap: break-word;
    font-size: large;
}

.box {
    width: 15px;
    height: 15px;
  }

.legendTextAlignNumber {
    font-size: 3vmin;
    text-align: center;
}

.legendTextAlignLabel{
    font-size: 2.5vmin;
    margin-left: 30%;
    margin-top: -20%;
}
Step4: Import and use Custom Legend in your App
We need to handle all events for sending the data to custom-legend component. (child component of the app component)
We will use simple parent-child communication strategy for sending data to custom-legend component.
Add following TypeScript code in app.component.ts file:
import { AfterViewInit, Component } from '@angular/core';
import { Subject } from 'rxjs';

@Component({
  selector: 'app-root',
  templateUrl: './app.component.html',
  styleUrls: ['./app.component.css']
})
export class AppComponent implements AfterViewInit {
  title = 'Custom-Legends';
  finalTestData: any = [];
  sampleDataWithColor: any = [];
  onHoverTrueEmitSubject: Subject<void> = new Subject<void>();
  onHoverFalseEmitSubject: Subject<void> = new Subject<void>();

  sampleData = [
    { name: "Germany", value: 105000 },
    { name: "USA", value: 55000 },
    { name: "France", value: 15000 },
    { name: "Spain", value: 150000 }
  ]

  constructor() { }

  ngAfterViewInit(): void {
    this.getColorCodes();
  }

  getColorCodes(): void {
    let element;
    let colorCode;

    for (let i = 0; i < this.sampleData.length; i++) {
      element = document.querySelector('[aria-label="' + this.sampleData[i].name + ' '
        + Intl.NumberFormat('en-US').format(this.sampleData[i].value) + '"');
      colorCode = element?.getAttribute("fill")
      this.sampleDataWithColor[i] = this.sampleData[i];
      this.sampleDataWithColor[i][i] = colorCode;
    }
  }

  onHover($event: any): void {
    this.onHoverTrueEmitSubject.next($event)
  }

  onHoverFalse($event: any): void {
    this.onHoverFalseEmitSubject.next($event)
  }

}
Add following HTML code in app.component.html file:
<div class="container row mx-auto mb-5 shadow mt-3">
  <h3>Custom Legend using NgX Bar Chart</h3>
  <small class="text-muted">Lorem ipsum dolor sit amet, consectetur adipisicing elit.</small>
  <div class="col-md-6">
    <ngx-charts-bar-vertical [view]="[550,400]" [results]="sampleData" [xAxisLabel]="'Country'" [yAxisLabel]="'Sale'"
      [showXAxisLabel]="true" [showYAxisLabel]="true" [xAxis]="true" [yAxis]="true" [animations]="true"
      [showDataLabel]="true" (activate)="onHover($event)" (deactivate)="onHoverFalse($event)">
    </ngx-charts-bar-vertical>
  </div>
  <div class="col-md-6">
    <app-custom-legend [data]="sampleDataWithColor" [onTrueHoverEvent]="onHoverTrueEmitSubject"
      [onFalseHoverEvent]="onHoverFalseEmitSubject" [height]="'13'" [width]="'19'">
    </app-custom-legend>
  </div>
</div>
That’s it, its ready. Simple, straight forward, customizable & reusable.
Enjoy and Happy Coding :)


